Running a freelance business without looking at your numbers is like driving with your eyes closed. Stintly™'s Reports section gives you clear visibility into where your money comes from, where it goes, and where it's headed - so you can make better decisions about pricing, client mix, and how you spend your time.
Profitability Reports
The core report in Stintly is the Profitability Report, which shows your business performance over any date range you choose - this week, this month, this quarter, or a custom period.
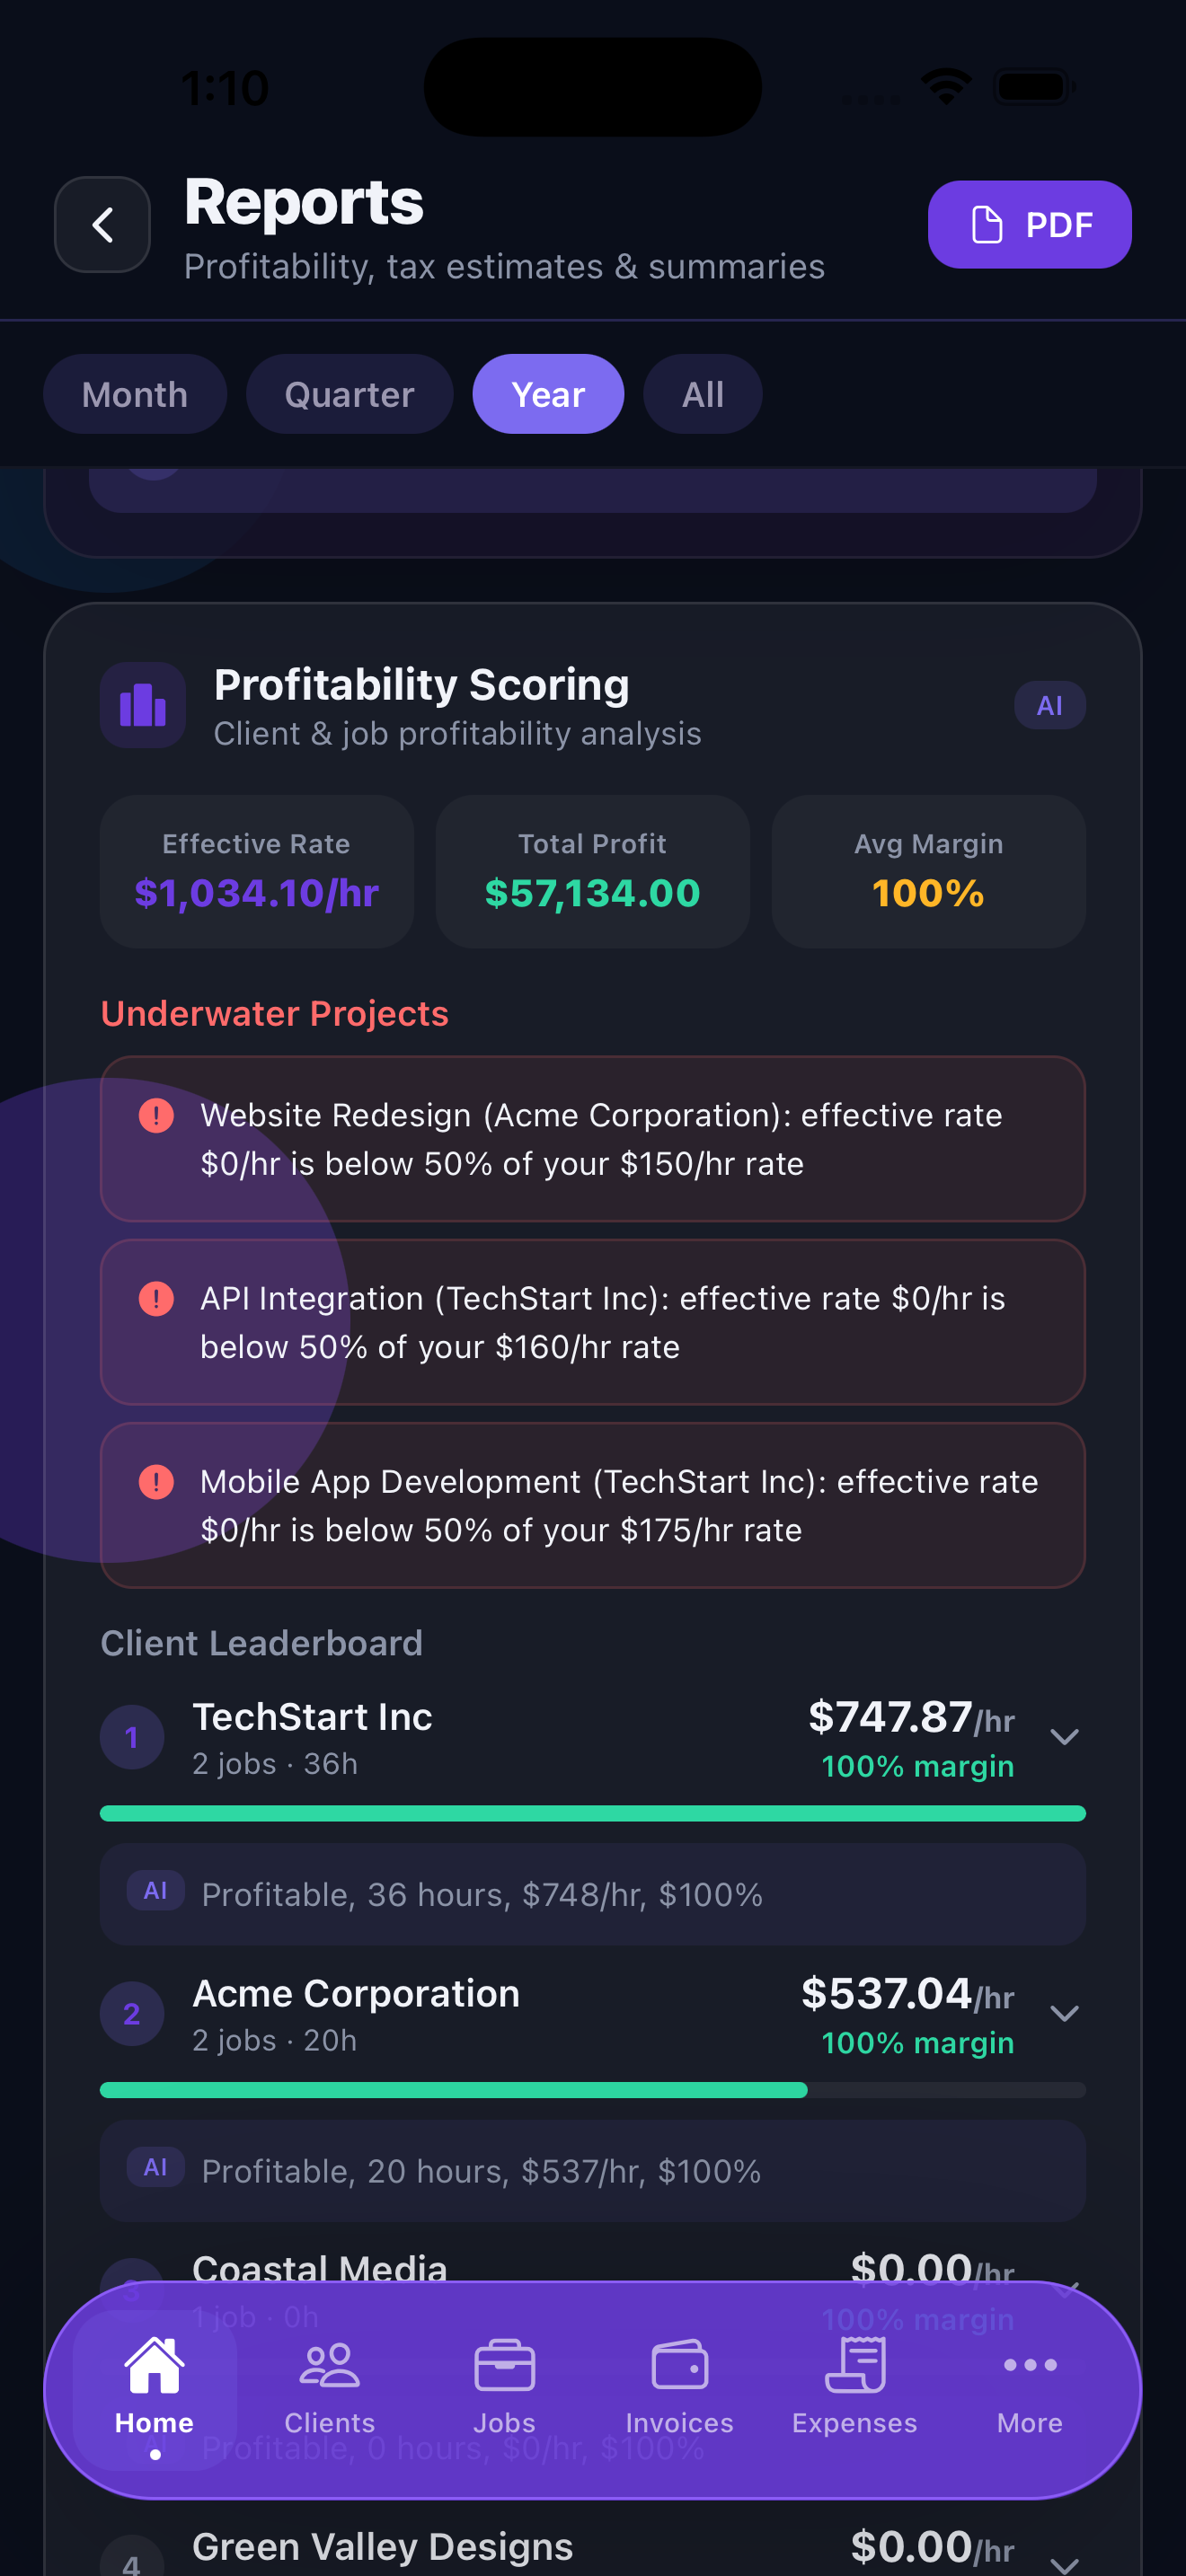
The report breaks down three key numbers:
- Revenue - Total invoiced income for the period, split between paid and outstanding invoices.
- Expenses - All recorded costs including materials, tools, and business expenses, categorized by type.
- Profit margin - Your net profit as a percentage of revenue. This is the number that tells you whether your business is actually sustainable at your current rates and volume.
Tap any section of the report to drill down into the underlying data - individual invoices, specific expense categories, or individual jobs that contributed to the totals.
Client Leaderboards
The client leaderboard ranks your clients by two metrics: total revenue and total profit. These often tell different stories. A client who pays a lot in revenue but requires expensive materials and many hours may be less profitable than a smaller client with a simple, high-margin job.
The leaderboard shows:
- Revenue rank - which clients bring in the most money
- Profit rank - which clients are actually the most valuable after expenses
- Average job value - how much each job is worth on average
- Jobs completed - how active the relationship has been
Use this view to identify your best clients and think critically about whether your lowest-ranked clients deserve the same level of attention and priority.
Income and Expense Breakdowns
Beyond the totals, Stintly breaks down your income and expenses in detail:
- Income by client - See which clients are driving your revenue month over month.
- Expenses by category - A pie chart and list showing where your money goes, mapped to Schedule C categories for tax purposes.
- Month-over-month trends - A bar chart showing revenue and expenses side by side across the last 12 months, making seasonal patterns easy to spot.
AI Revenue Forecasts
Available on Premium, the Forecasts tab shows AI-generated 3-month revenue projections based on your historical income patterns, current active jobs, and outstanding invoices.
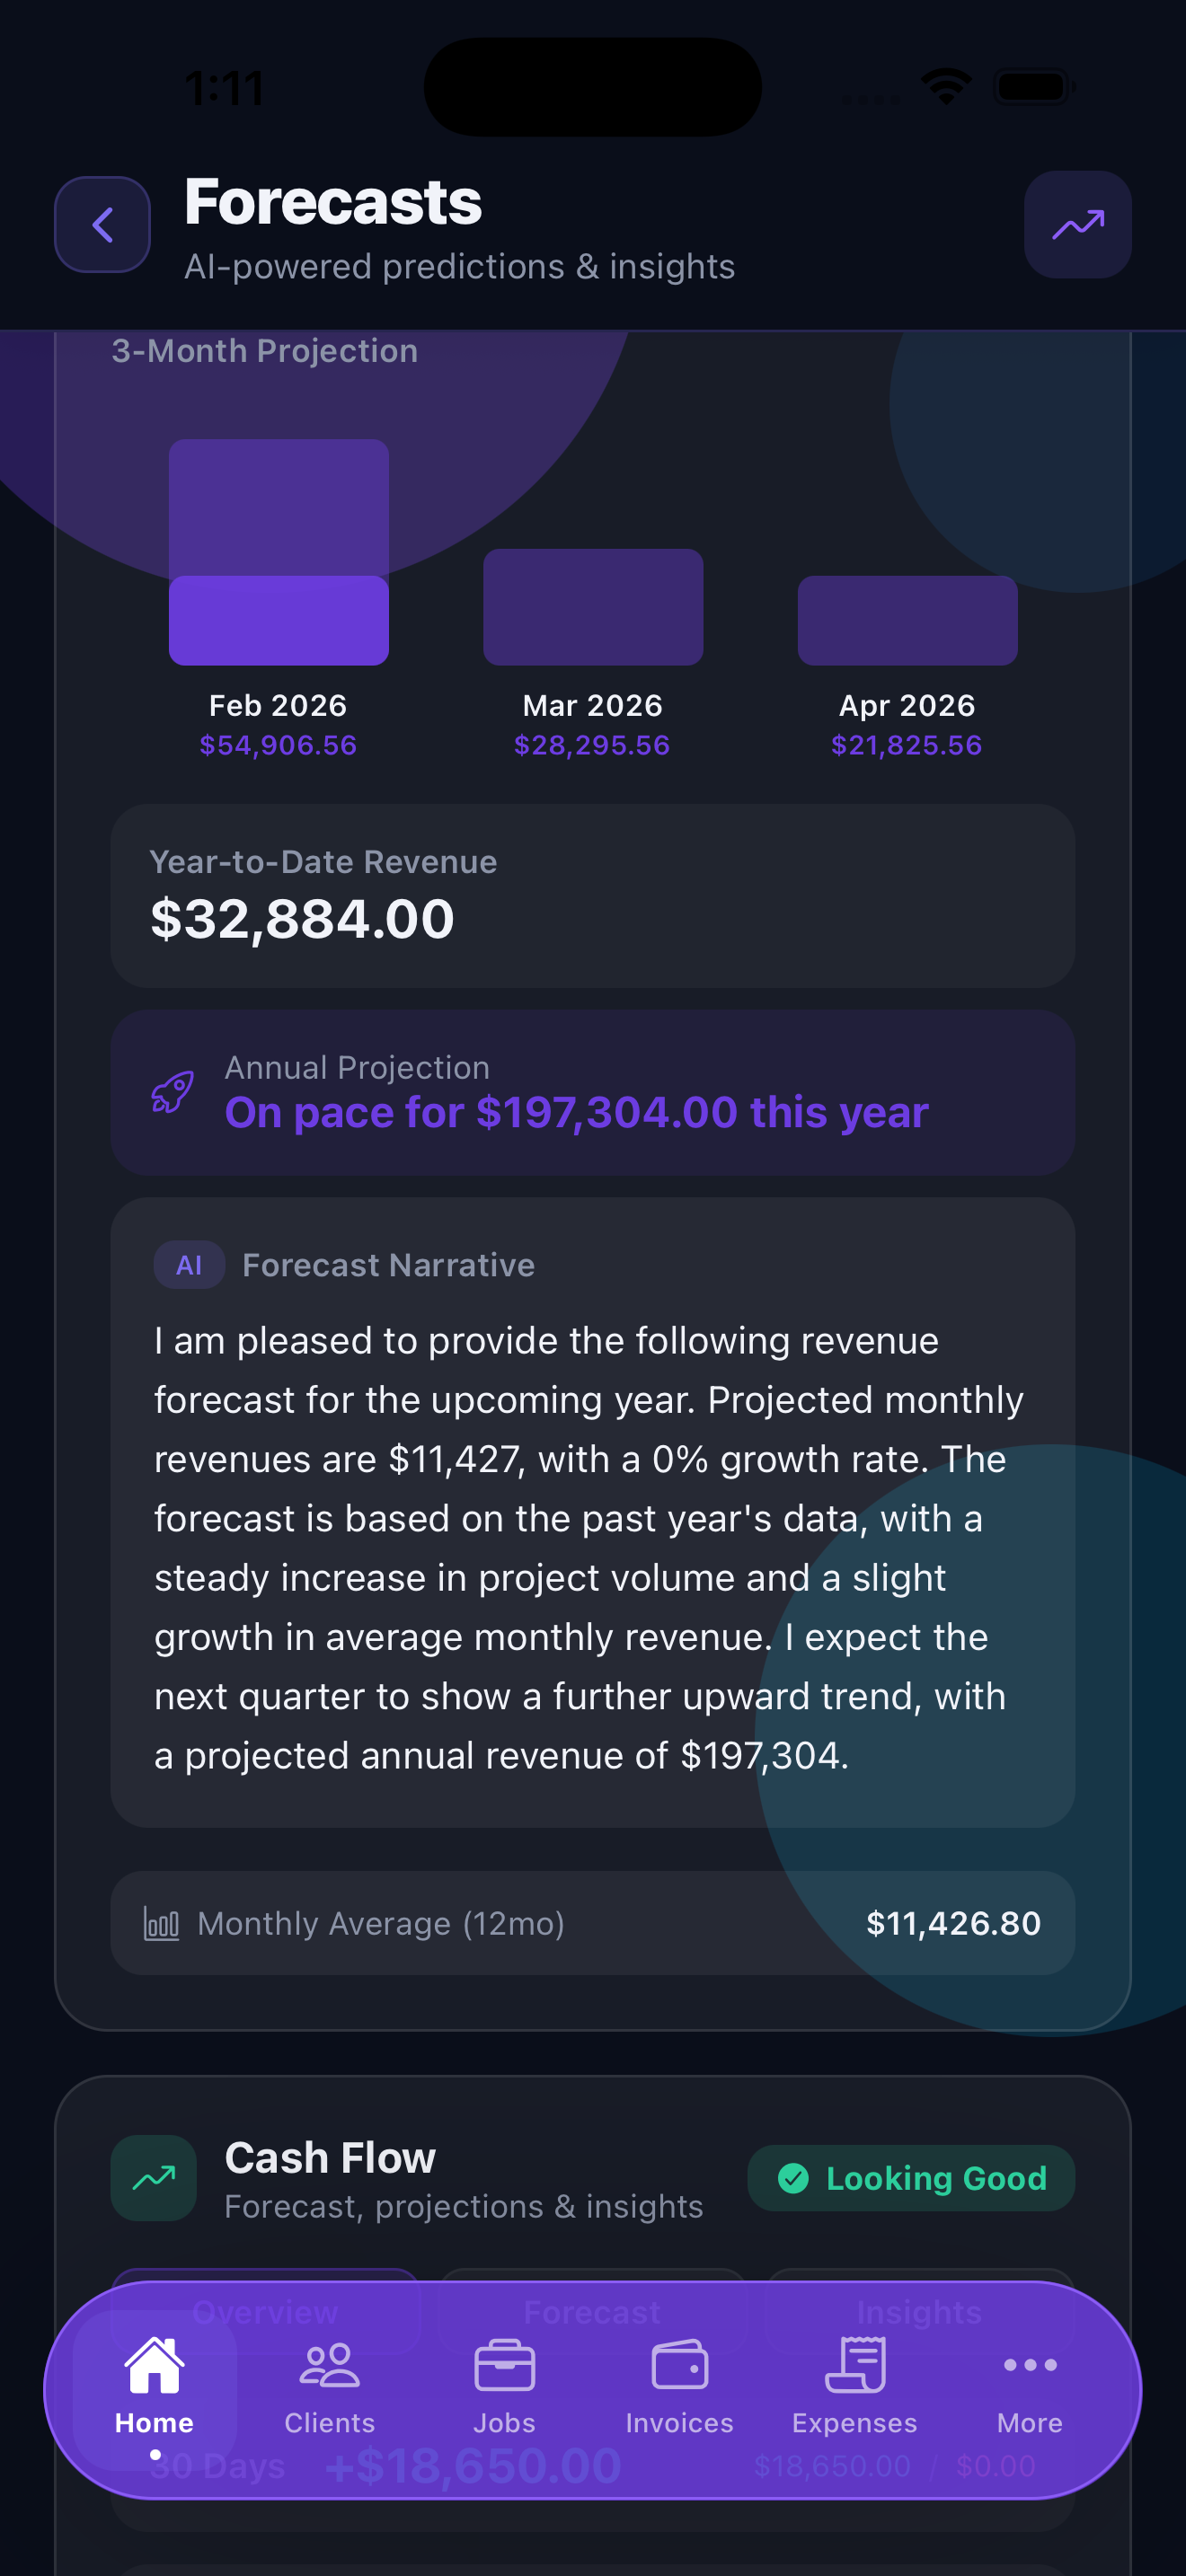
The forecast model considers:
- Your average monthly revenue over the past 6 months
- Seasonal patterns in your historical data
- Revenue from jobs that are currently in progress
- Expected payment timing from outstanding invoices
The forecast shows a base case alongside an optimistic and conservative range, so you can plan for different scenarios. Forecasts become more accurate the more historical data you have in Stintly.
Forecasts are projections based on your data, not guarantees. Use them as a planning tool alongside your own knowledge of upcoming work.
Cash Flow Analysis
Available on Premium, Cash Flow Analysis shows the timing difference between when you earn money and when it actually lands in your account. This matters because you can be "profitable on paper" and still run out of cash if clients pay slowly.
The cash flow view shows:
- Expected cash inflows from outstanding invoices, by week
- Upcoming known expenses (subscriptions, estimated taxes due)
- Projected cash balance week by week for the next 90 days
- Weeks where cash may be tight based on payment patterns
If a cash shortfall is projected, Stintly highlights the period in amber or red so you can take action - chase a slow-paying invoice, push a non-urgent expense, or line up a new client before the dip hits.
AI Business Narrative
Available on Premium, the AI Business Narrative feature generates human-readable summaries of your business performance. Instead of reading charts, you get plain-English insights:
- Weekly summary - A brief paragraph covering what happened this week: revenue logged, invoices sent, expenses recorded, and anything notable compared to last week.
- Daily insights - Short, actionable observations surfaced each morning. For example: "You have three invoices totaling $4,200 that are more than 14 days overdue. Reaching out today could significantly improve this month's cash position."
These narratives are generated on-device, so your financial data never leaves your phone. They refresh each morning when you open the app.
Sharing Reports as PDF
Any report in Stintly can be exported as a clean, formatted PDF. This is useful for:
- Sharing a monthly summary with your accountant
- Presenting business performance to a business partner
- Keeping a personal record of each year's financial performance
- Including in a loan application or line of credit request
To export a PDF, tap the share icon in the top-right corner of any report. Choose Export as PDF, preview the report, and then share it via email, AirDrop, or any other app on your device. The PDF includes your business name, the date range, and a summary page followed by detailed tables.
Tips for Using Reports Effectively
- Review reports weekly, not just at year-end. A 10-minute weekly review of your numbers catches problems early and keeps you informed about your business trajectory.
- Use forecasts to plan for slow months. If your forecast shows a dip in revenue two months out, start marketing now or reach out to existing clients about upcoming projects. Don't wait until the slow month arrives.
- Share reports with your accountant quarterly. A quarterly PDF export gives your accountant enough information to flag any issues well before tax filing season, when their capacity is stretched.
- Compare profit margin, not just revenue. Growing revenue while letting expenses grow faster is a common trap. Keep an eye on your profit margin percentage to ensure growth is actually adding to your bottom line.
See your business clearly.
Download Stintly and turn your project data into actionable reports and forecasts. Make smarter decisions with numbers you can actually trust.
Download on the App Store